
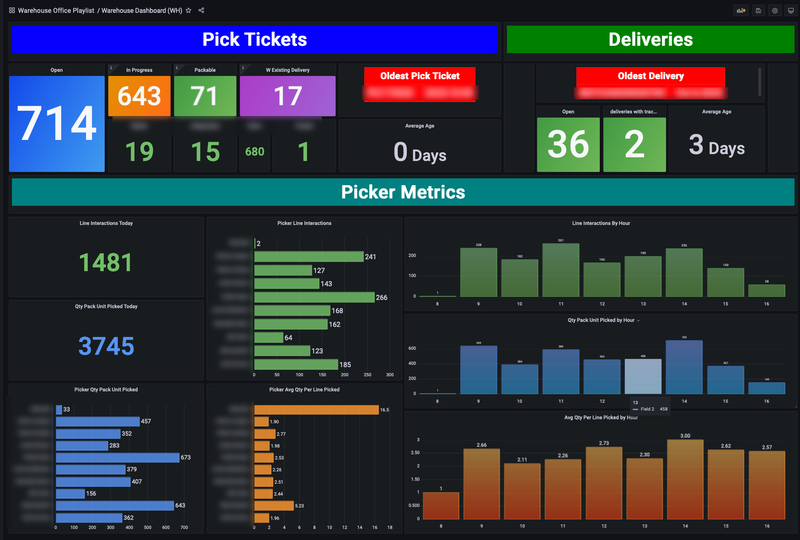
Most businesses do not have a data problem. They have a timing problem. The numbers exist in the ERP, but by the time someone exports them and builds a report, the shift is over and the decision has already been made by guessing.
We build operational dashboards for Sage X3 and Sage 300 users, so this post is about what we have seen change once managers can see the floor as it runs.
1. Pick ticket status, by stage
How many orders are waiting, being picked, packed, and staged right now. Not yesterday's count. This is the first thing a warehouse lead looks at in the morning and the last thing before the trucks leave.
2. Delivery aging
Which orders are past their promise date and by how much. Aging turns a vague feeling that things are slipping into a list of five orders that need a phone call today.
3. Picker productivity
Lines picked per hour, per person. Used well, this is a coaching tool. It shows who needs help, which zones are slow, and whether a layout change worked.
4. Hourly throughput trends
Volume by hour across the day and the week. This is how you staff. If Tuesday afternoons always spike, you schedule for it instead of reacting to it.
5. Your own metric
Every operation has one number that matters more than the others. Backorders. Returns. Cases per pallet. The dashboard should show that one too.
What this is not
These are near real-time operational views, refreshed every few minutes, built in Grafana against your ERP. They replace the spreadsheet somebody rebuilds every Monday. They do not replace your ERP, and we do not pretend they run your inventory.
If you run Sage X3 or Sage 300 and want to see your warehouse on one screen, start here.


